Getting Started with DataSQRL
The easiest way to understand how DataSQRL provides guardrails and feedback for AI coding agents is to build a data pipeline. We'll create a messenger pipeline, then let a coding agent extend it using DataSQRL's test-driven feedback loop.
Prerequisites
You'll need:
- Docker installed and running
- A terminal (macOS/Linux: Terminal, Windows: PowerShell or WSL)
- A coding agent (Claude Code, Codex, Gemini CLI, Copilot, or similar)
Install Docker
If you don't already have Docker:
- macOS: Download Docker Desktop for Mac
- Windows: Download Docker Desktop for Windows
- Linux: Use your package manager (e.g.,
sudo apt install docker.io)
Verify Docker is working:
docker --version
Create New Project
Create a new data project with the init command in an empty folder:
docker run --rm -v $PWD:/build datasqrl/cmd init api messenger
(Use ${PWD} in Powershell on Windows)
This creates a data API project called messenger with sample data sources and a processing script called messenger.sqrl.
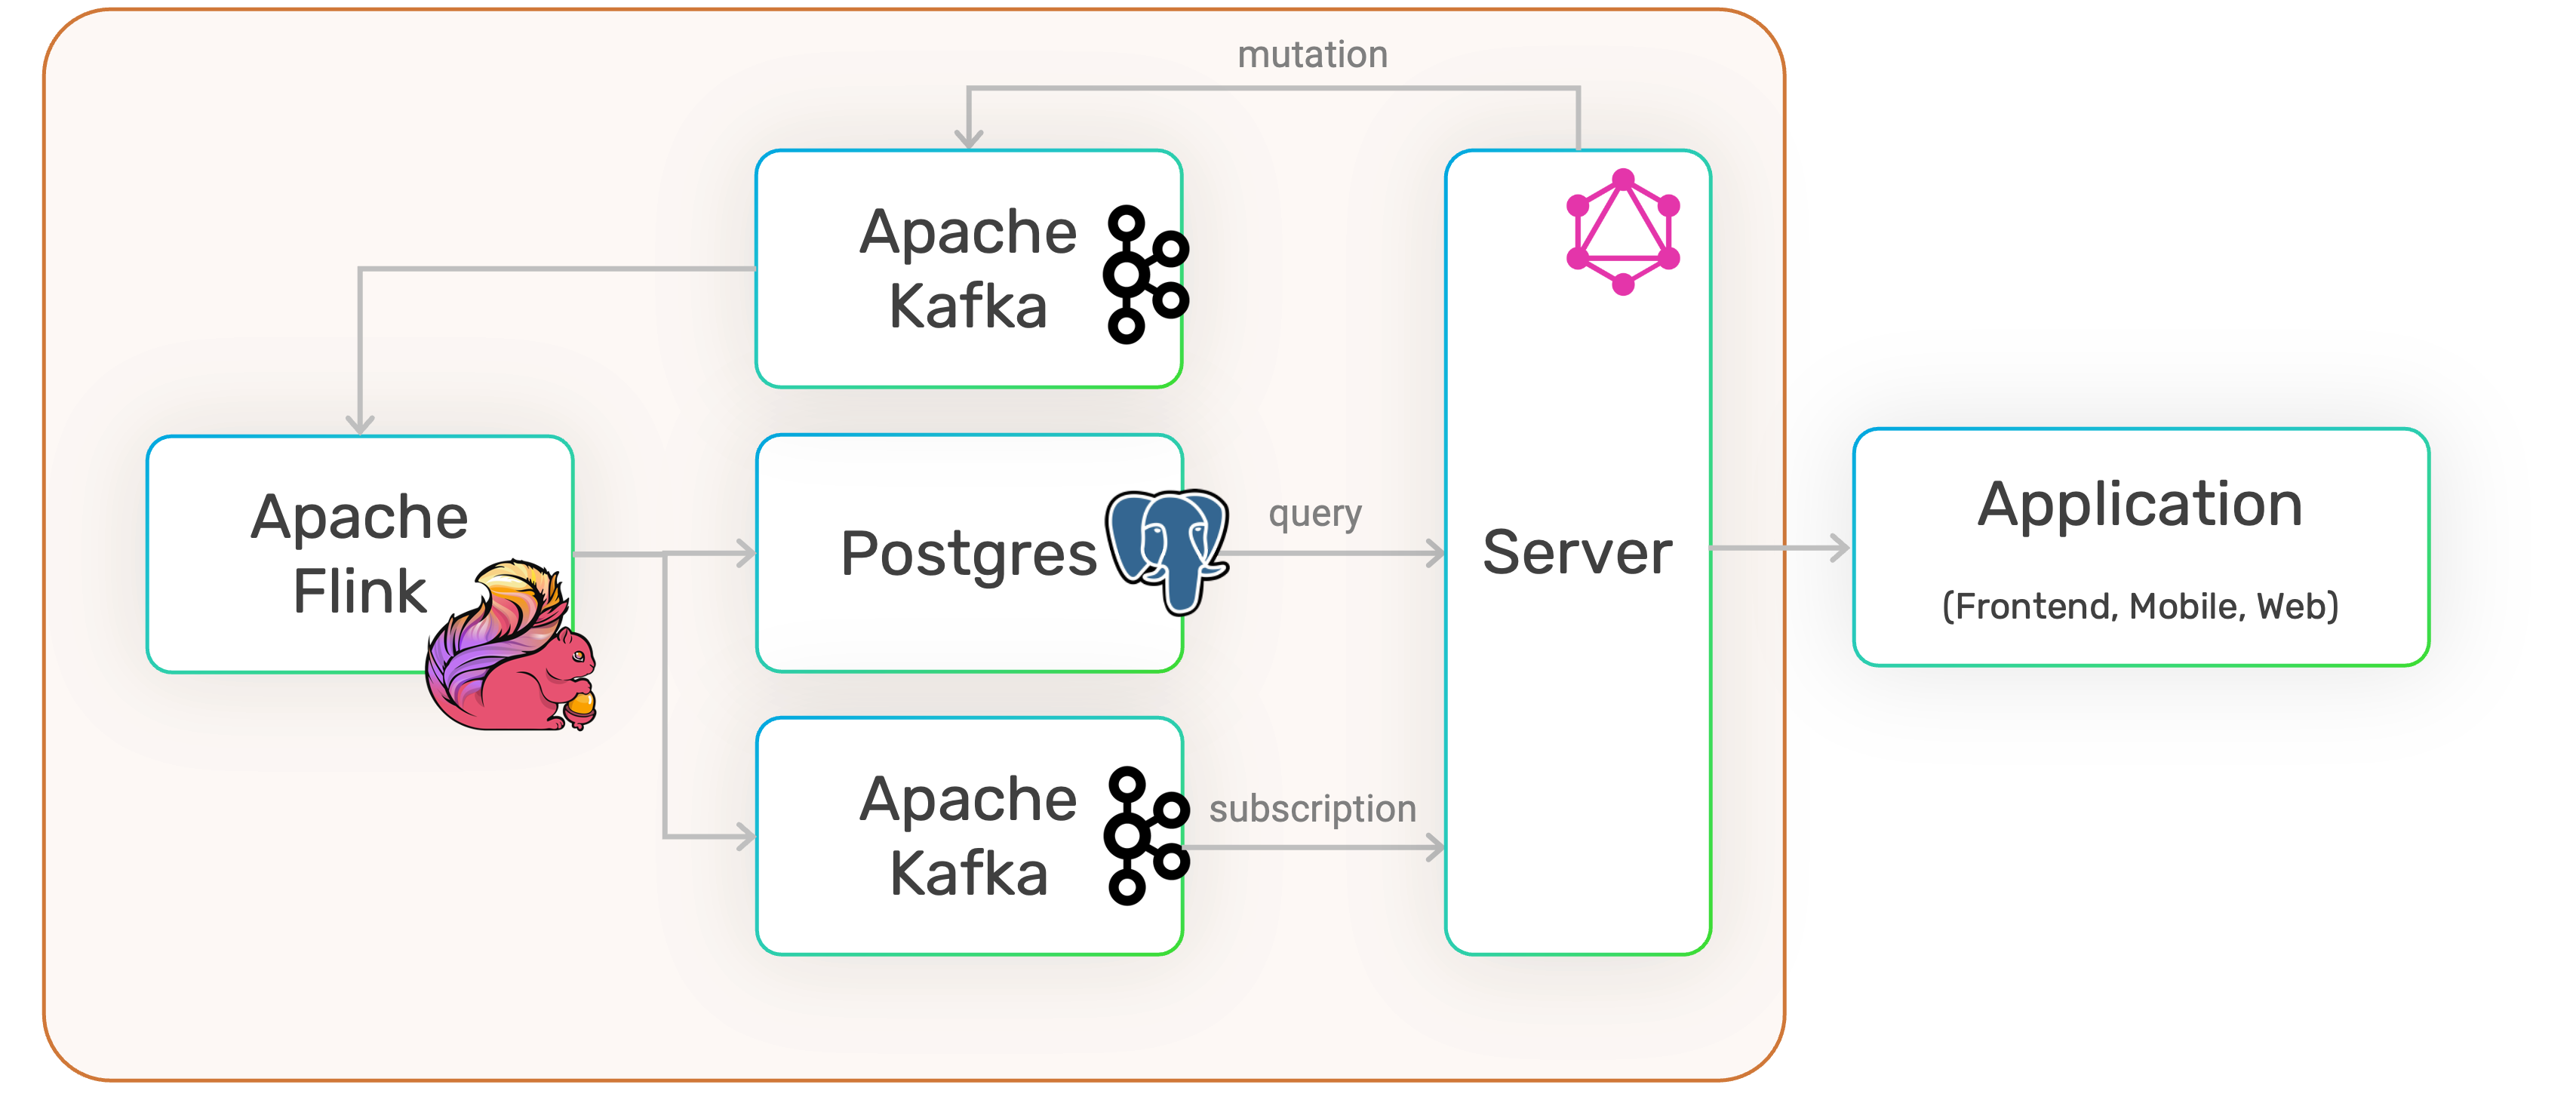
The engines executing the pipeline are defined in the package.json files:
Run the Pipeline
Execute the SQRL project:
docker run -it --rm -p 8888:8888 -p 8081:8081 -v $PWD:/build datasqrl/cmd run messenger-prod-package.json
Access the GraphQL API at http://localhost:8888/v1/graphiql/.
Add a message:
mutation {
    Messages(event: {message: "Hello World"}) {
        message_time
    }
}
Query messages:
{
    Messages {
        uuid
        message
        message_time
    }
}
Terminate with CTRL-C.
Let Agents Extend the Pipeline
Now instruct your coding agent to extend messenger.sqrl. For example:
"Add an endpoint that returns the total message count and the timestamp of the most recent message. Include test coverage."
The agent should modify messenger.sqrl and iterate using the test command:
docker run -it --rm -v $PWD:/build datasqrl/cmd test messenger-test-package.json
This feedback loop is how DataSQRL guides agents toward correct solutions. The test command:
- Compiles the SQRL script and validates semantics
- Runs the pipeline in simulation with timestamp-accurate event replay
- Compares results against snapshot expectations
The first time a new test runs, it creates a snapshot. Subsequent runs validate against that snapshot. When tests fail, the compiler provides actionable error messages that help agents refine their solution.
A correct implementation might look like:
TotalMessages := SELECT COUNT(*) as num_messages, MAX(message_time) as latest_timestamp
                 FROM Messages LIMIT 1;
Add Real-Time Subscriptions
Ask your agent to add a subscription for error messages:
"Add a subscription that pushes messages containing the word 'error' to consumers in real-time."
The agent should add something like:
AlertMessages := SUBSCRIBE SELECT * FROM Messages WHERE LOWER(message) LIKE '%error%';
Run the production version to test subscriptions:
docker run -it --rm -p 8888:8888 -p 8081:8081 -v $PWD:/build datasqrl/cmd run messenger-prod-package.json
In GraphiQL, start a subscription:
subscription {
    AlertMessages {
        uuid
        message
        message_time
    }
}
In a new browser tab, add an error message:
mutation {
    Messages(event: {message: "I found an ERROR! Oh no"}) {
        message_time
    }
}
The subscription tab should show the message pushed through in real-time.
Improving Agent Performance
Agent performance improves significantly when they understand DataSQRL's capabilities. Point your agent to:
- SQRL Language Reference: Stream processing semantics, temporal joins, windowed aggregations, and SQRL-specific syntax
- Configuration Guide: Package configuration, engine selection, and deployment options
For more complex projects, consider creating a custom instructions file that includes relevant documentation snippets. Agents that understand SQRL patterns like CDC deduplication, temporal enrichment joins, and subscription syntax produce better results with fewer iterations.
Compile for Deployment
Build deployment artifacts:
docker run --rm -v $PWD:/build datasqrl/cmd compile messenger-prod-package.json
The build/deploy/plan directory contains:
- Flink compiled plans
- Kafka topic definitions
- PostgreSQL schemas and views
- Server queries and GraphQL models
The build directory includes files useful for inspection and verification:
pipeline_visual.html: Visual representation of the pipeline DAGpipeline_explain.txt: Textual DAG representation for coding agentsinferred_schema.graphqls: Generated GraphQL schema
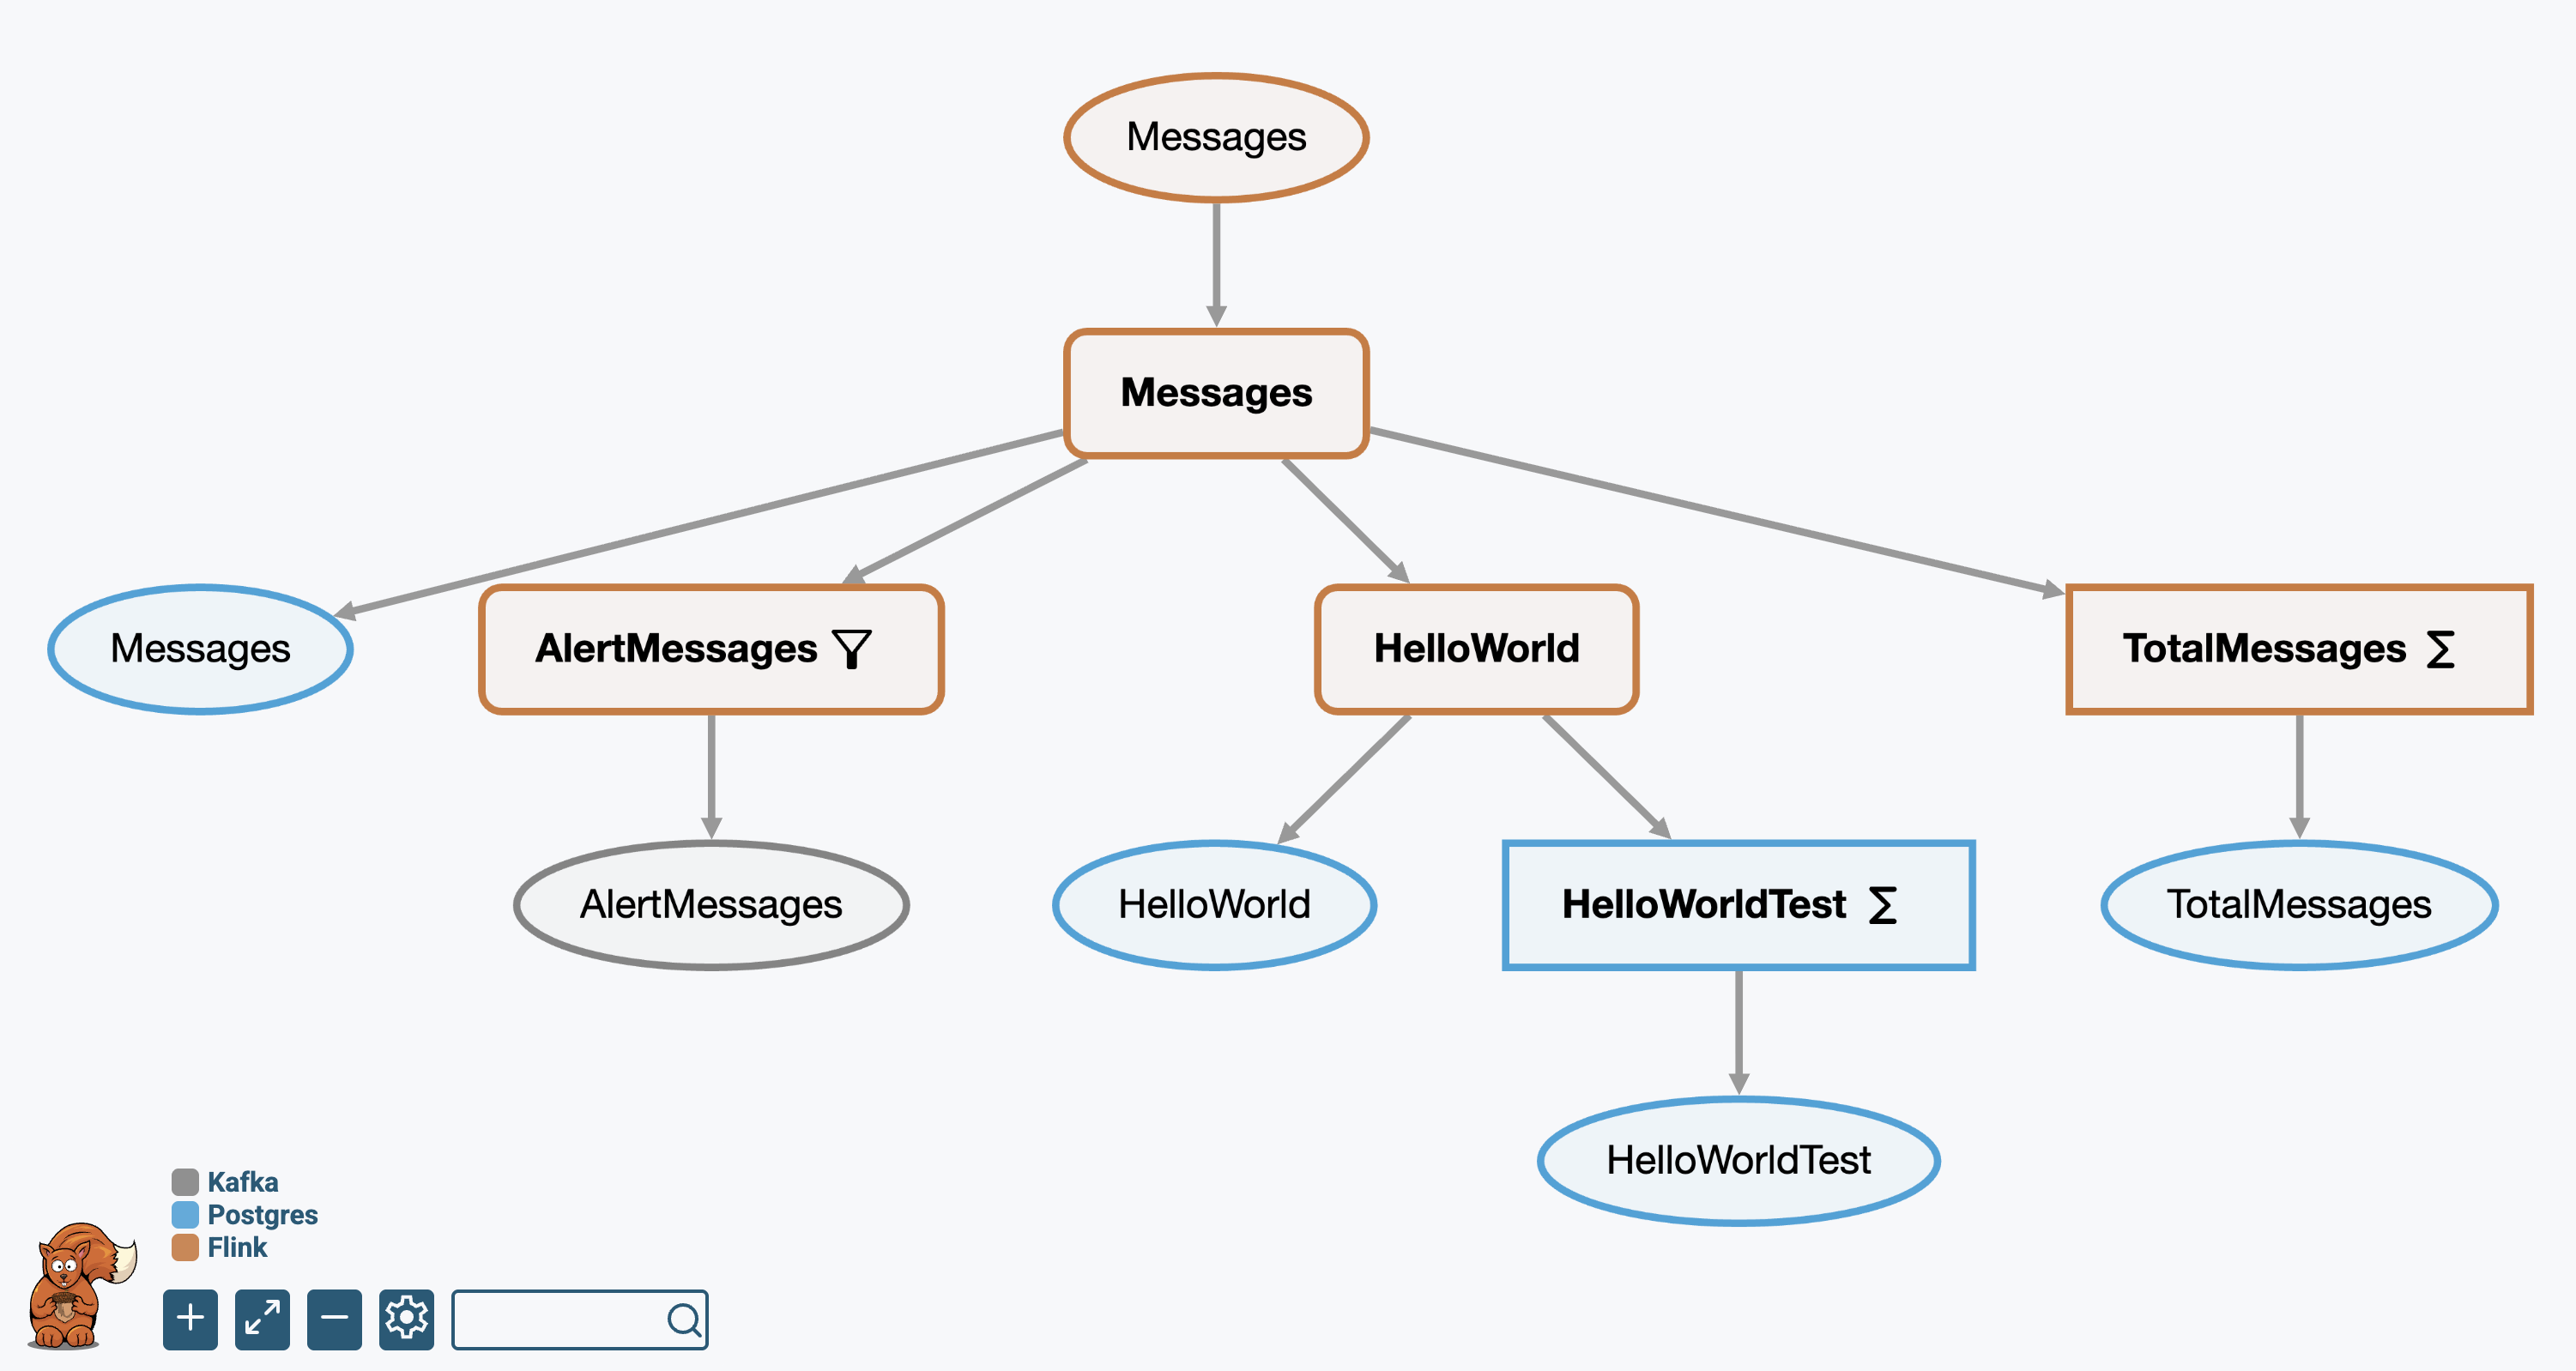
Click nodes in the visualization to inspect schema, logical plan, and physical plan details. The deployment artifacts support human validation of pipeline correctness and quality. You can use them to build an ensemble of judges to provide automatic validation of compliance, governance, and reliability requirements.
Next Steps
You've seen how DataSQRL provides the feedback loop that coding agents need to build production-grade data pipelines. The test command validates agent-generated code, the compiler provides actionable errors, and the simulator ensures real-world correctness.
Next:
- Full Documentation: Complete reference and language spec
- Tutorials: Learn by building more complex pipelines
- Example Projects: See real-world patterns in action
Troubleshooting
- Ports already in use: Check if 8888 or 8081 is being used by another app
- Agent not understanding SQRL: Share the SQRL Language Reference with your agent
- Test failures: Review the error output—DataSQRL provides specific guidance on what to fix