Getting Started with DataSQRL
Welcome to DataSQRL! This guide walks you through building and running your first data pipeline using SQRL — from setup to customization and debugging.
We are going to build a data pipeline with SQRL that:
- Defines an API to receive user token usage data
- Aggregates total token consumption per user
- Triggers alerts when a single request exceeds 100,000 tokens
Prerequisites
You'll need:
- Docker installed
- A terminal (macOS/Linux: Terminal, Windows: PowerShell or WSL)
- Basic understanding of SQL
Install Docker
If you don't already have Docker:
- macOS: Download Docker Desktop for Mac
- Windows: Download Docker Desktop for Windows
- Linux: Use your package manager (e.g.,
sudo apt install docker.io)
Verify Docker is working:
docker --version
Make sure Docker is running before continuing.
Define SQRL Script
mkdir myproject && cd myproject
vi usertokens.sqrl
Paste this into usertokens.sqrl:
/*+no_query */
CREATE TABLE UserTokens (
    userid BIGINT NOT NULL,
    tokens BIGINT NOT NULL,
    request_time TIMESTAMP_LTZ(3) NOT NULL METADATA FROM 'timestamp'
);

/*+query_by_all(userid) */
TotalUserTokens := SELECT userid, sum(tokens) as total_tokens,
                          count(tokens) as total_requests
                   FROM UserTokens GROUP BY userid;

UsageAlert := SUBSCRIBE SELECT * FROM UserTokens WHERE tokens > 100000;
- UserTokens defines the input data we use for data collection which is exposed as a mutation endpoint. The mutation endpoint has the same schema as the table minus the metadata columns which are automatically inserted from the context. In this example, the
timestampmetadata refers to the timestamp of the mutation request which gets stored in therequest_timecolumn. - TotalUserTokens defines a derived table that aggregates the user tokens by
userid. Thequery_by_all(userid)hint specifies that this table is accessible through a query endpoint that requires auseridargument. - UsageAlert defines a table that contains all requests where the token consumption exceeds
100,000. TheSUBSCRIBEkeyword means that this table is exposed as a subscription in the API.
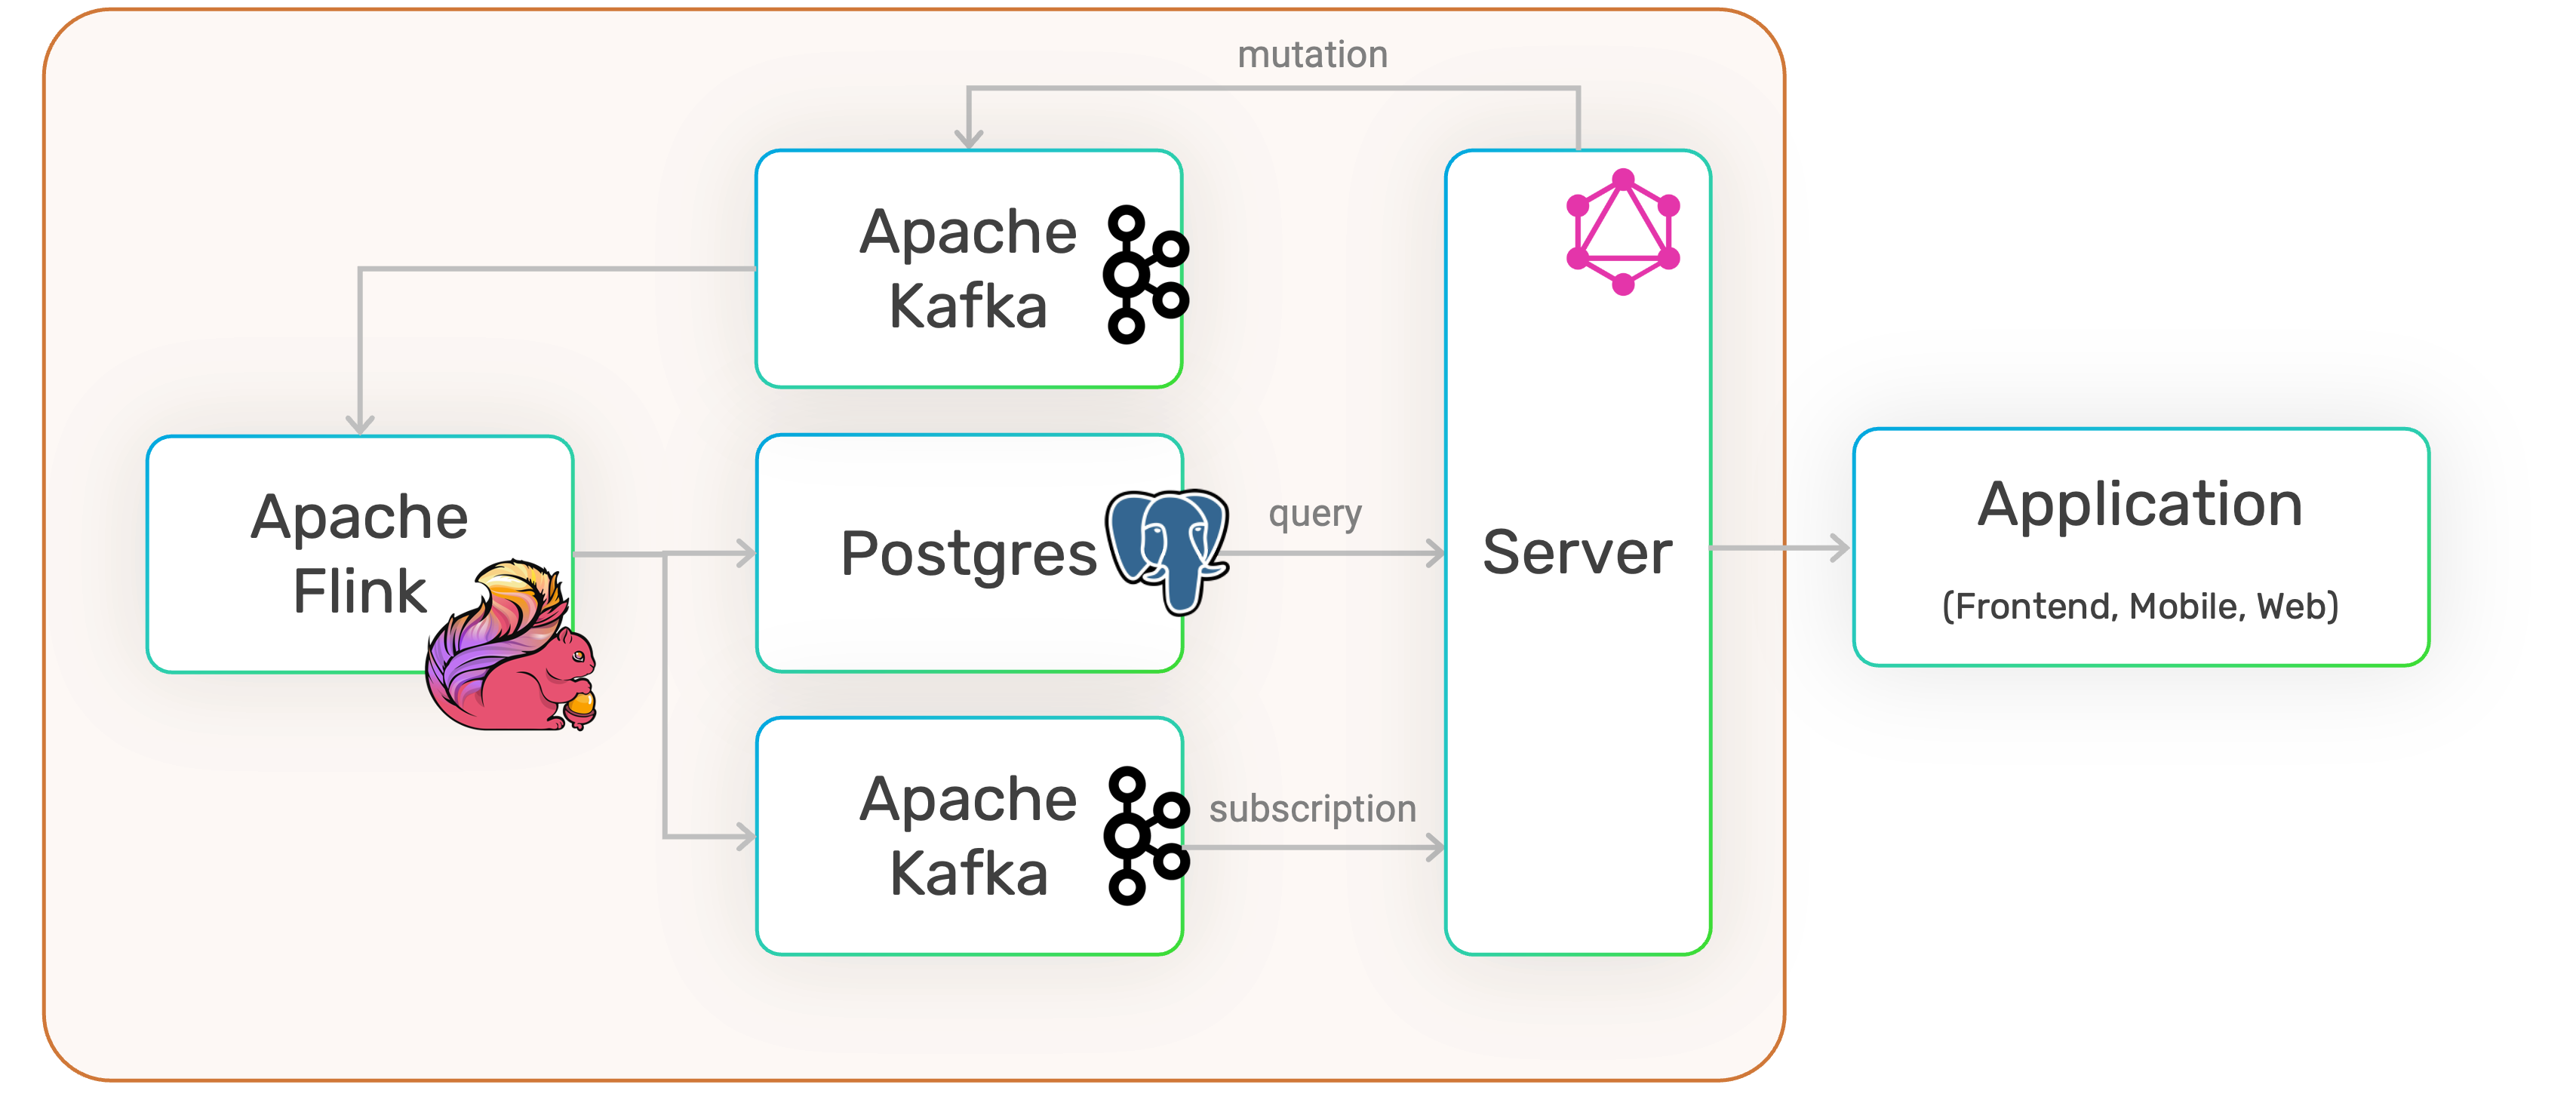
The architecture of the pipeline defined by the SQRL script looks as follows:
Run SQRL Script
We can now execute the SQRL script with the compiler:
docker run -it --rm -p 8888:8888 -p 8081:8081 -p 9092:9092 -v $PWD:/build datasqrl/cmd:latest run usertokens.sqrl
(Use ${PWD} in Powershell on Windows).
Note, that we are mapping the local directory so the compiler has access to the script. We are also mapping a number of ports, so we have access to the API and visibility into the pipeline.
Access the API
The pipeline is exposed through a GraphQL API that you can access at http://localhost:8888/graphiql/ in your browser.
To add user token requests, we run the following mutation:
mutation {
 UserTokens(event: {userid: 1, tokens:500}) {
  request_time
}
}
Copy the query into the left-hand panel and click on the "play" button to see the result.
To query the aggregated statistics, run the following query:
{
 TotalUserTokens(userid:1) {
  total_tokens
  total_requests
}
}
To get a push-alert for high token consumption, first run the following subscription:
subscription {
  UsageAlert {
    userid
    tokens
  }
}
While the subscription is running, open a new browser tab for GraphiQL and execute this mutation:
mutation {
 UserTokens(event: {userid: 2, tokens:400000}) {
  request_time
}
}
If you toggle back to the subscription tab, you should see the request.
Once you are done, terminate the pipeline with CTRL-C.
Extend the SQRL Script
We are going to add information about the user so we can associate token consumption with the organization the user is part of.
To demonstrate how to integrate external data sources, we assume that the user information is stored in another system and that we consume a CDC stream of that data. We are going to simulate that CDC stream in the following JSON file:
{"userid":  1, "orgid":  2, "last_updated": "2025-04-20T18:12:00.000Z"}
{"userid":  2, "orgid":  2, "last_updated": "2025-04-21T11:23:00.000Z"}
{"userid":  3, "orgid":  1, "last_updated": "2025-04-24T07:15:00.000Z"}
{"userid":  1, "orgid":  2, "last_updated": "2025-04-25T19:34:00.000Z"}
{"userid":  2, "orgid":  1, "last_updated": "2025-04-25T21:47:00.000Z"}
Create the file local-data/userinfo.jsonl in a new sub-directory local-data.
Now add the following to your usertokens.sqrl script:
IMPORT local-data.userinfo AS _UserInfo;

_CurrentUserInfo := DISTINCT _UserInfo ON userid ORDER BY last_updated DESC;

_EnrichedUserTokens := SELECT t.*, u.orgid FROM UserTokens t
   JOIN _CurrentUserInfo FOR SYSTEM_TIME AS OF t.request_time u ON u.userid = t.userid;

TotalOrgTokens := SELECT orgid, sum(tokens) as total_tokens,
                         count(tokens) as total_requests
                  FROM _EnrichedUserTokens GROUP BY orgid;

TotalOrgTokensByRange( minTokens BIGINT NOT NULL, maxTokens BIGINT NOT NULL) :=
    SELECT * FROM TotalOrgTokens
    WHERE total_tokens >= :minTokens AND total_tokens <= :maxTokens;
- _UserInfo: We import the data from the
userinfo.jsonlfile with the IMPORT statement. Note that we are renaming the table to start with an underscore which "hides" to table since we don't want this data exposed in the API. - _CurrentUserInfo: The imported data is a CDC stream. To get the most recent information for each user, we deduplicate the data with the
DISTINCTstatement. - _EnrichedUserTokens enriches the stream of requests with the user information through a temporal join which ensures that we join the stream with the user info that was valid at the point of time when the stream record gets processed. This ensures data consistency.
- TotalOrgTokens aggregates the total tokens by organization.
- TotalOrgTokensByRange defines a query endpoint for the TotalOrgTokens table to query by token range. This function defines two parameters
minTokensandmaxTokensand references those in the query using the:parameter prefix.
You can run the script and access the API like we did above.
Note, that when you compile or run the script, the compiler automatically created a connector table from the data in the local-data/userinfo.table.sql file. DataSQRL can automatically infer the schema from JSONL or CSV files and generate connectors.
You can also define connectors manually to ingest data from Kafka, Kinesis, Postgres, Apache Iceberg, and many other sources. Check out the Connectors Documentation to learn how to ingest data from and sink data to many external data systems.
Testing
We can add tests to a SQRL script to ensure it produces the right data, automate those tests to avoid regressions, and enable deployment automation in CI/CD pipelines.
Tests can be added directly to the SQRL script with the /*+test */ hint:
/*+test */
UserTokensTest := SELECT * FROM TotalUserTokens ORDER BY userid ASC;

/*+test */
OrgTokensTest := SELECT * FROM TotalOrgTokens ORDER BY orgid ASC;
Add those two test cases to the usertokens.sqrl script.
We can also add tests as GraphQL queries that get executed against the API. For our example, we need to add a mutation query - otherwise there is no input data to test against.
Add the folder tests in the root of the project and add the following mutation query in the file tests/addTokens-mutation.graphql to add some test data:
mutation {
    Token1: UserTokens(event: {userid: 1, tokens: 500}) {
        userid
    }
    Token2: UserTokens(event: {userid: 2, tokens: 100}) {
        userid
    }
    Token3: UserTokens(event: {userid: 2, tokens: 200}) {
        userid
    }
    Token4: UserTokens(event: {userid: 1, tokens: 700}) {
        userid
    }
}
Now you can run the test cases with the command:
docker run -it --rm -v $PWD:/build datasqrl/cmd:latest test usertokens.sqrl
When you first run new tests, the test runner creates snapshots for each test case. When you run the test again, it will succeed if the snapshots match or fail if they don't.
Deployment
To build the deployment assets in the for the data pipeline, execute
docker run --rm -v $PWD:/build datasqrl/cmd:latest compile usertokens.sqrl
The build/deploy directory contains the Flink compiled plan, Kafka topic definitions, PostgreSQL schema and view definitions, server queries, and GraphQL data model.
The build directory contains two files that are useful to visualize, inspect, and document the data pipelines you create with DataSQRL.
pipeline_visual.htmlis a visual representation of the entire data pipeline. Open this file in your browser.pipeline_explain.txtcontains a textual representation of the pipeline DAG that DataSQRL generates.
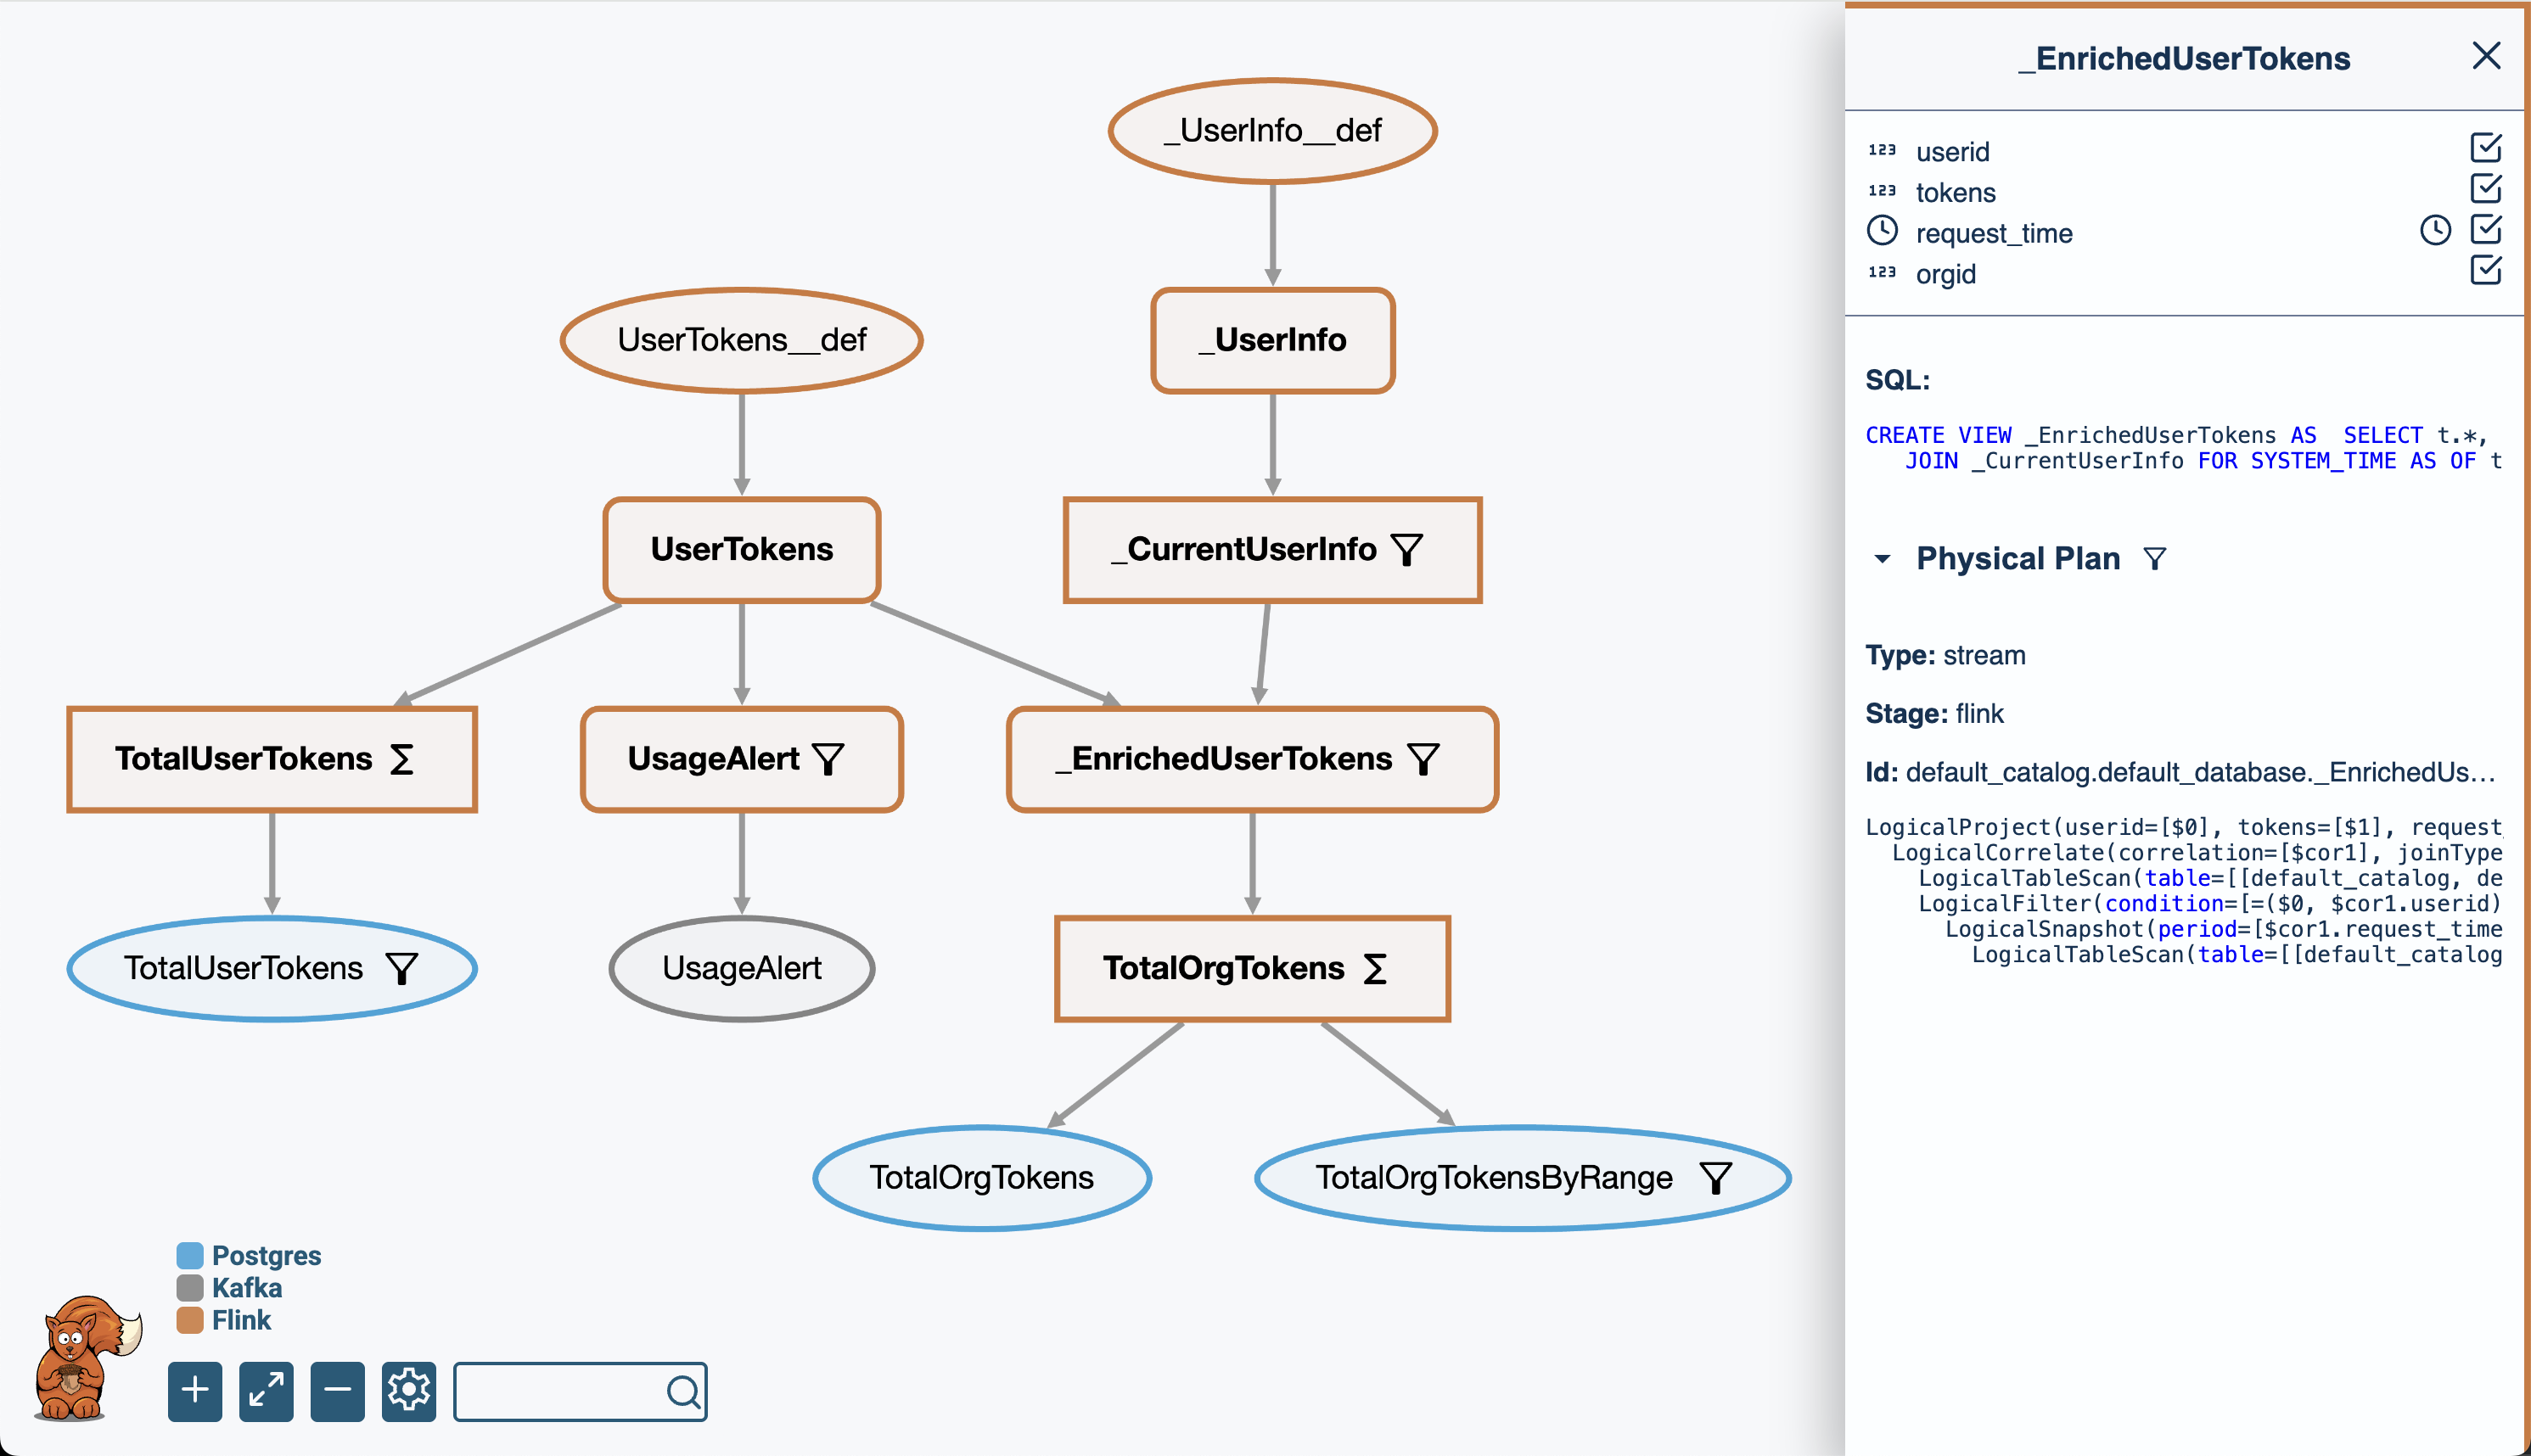
The picture above is the visualization of the pipeline we have build thus far. You can click on the individual nodes in the graph to inspect the schema, logical, and physical plan.
Customize GraphQL Schema
To inspect the GraphQL API that DataSQRL generates from the SQRL script, execute:
docker run --rm -v $PWD:/build datasqrl/cmd:latest compile usertokens.sqrl --api graphql
This creates a file called schema.graphqls in the project root directory.
To make adjustments to the GraphQL schema, rename the file to usertokens.graphqls before making modifications: removing fields, changing default values, renaming types, etc. To build the project with the adjusted schema, execute:
docker run --rm -v $PWD:/build datasqrl/cmd:latest compile usertokens.sqrl usertokens.graphqls
Next Steps
Congratulations, you made the first big step toward building production-grade data pipelines the easy way. Next, check out:
- Full Documentation for the complete reference, language spec, and more.
- Tutorials if you prefer learning by doing.
4. Troubleshooting Common Issues
- Ports already in use: Check if 8888 or 8081 is being used by another app